
The Evidence Crisis in Math Reform, Part 2
Stanford's education research center, YouCubed, revised a paper after I pointed out incorrect data. The new version revealed bigger problems.


Rahim Nathwani is a technologist based in San Francisco, making businesses better with tech and AI. He believes almost everyone can and should learn more math. His 9-year-old son is on track to complete Algebra 1 before 5th grade.
Attacks on Excellence is a series from Education Progress featuring critical coverage of the education policies and research paradigms that are holding students back. If you haven’t read Part 1 yet, check it out below!

A few weeks ago, I wrote an article showing that a YouCubed paper presented data that didn’t match the public record.
Before writing that article, I replied to the X post in which the co-author, Stanford University Education Professor Dr. Jo Boaler, shared a link to the paper. She did not respond. I then filed a public records request with Healdsburg Unified School District (HUSD). That request led to a series of email exchanges with the paper’s other co-author, Dr. Erin Fender.
Dr. Fender was responsive from the start, even though she’s a busy school administrator. She runs day-to-day operations as both Director of Alternative Education and Principal of a community school at the Sonoma County Office of Education.
She told me that, although the chart was labeled HUSD, it in fact showed data from one specific school: Healdsburg Elementary School (HES). She shared the spreadsheet in which she had assembled the data. Unfortunately, the discrepancy wasn’t just a labeling problem. Even the HES data didn’t match the spreadsheet:
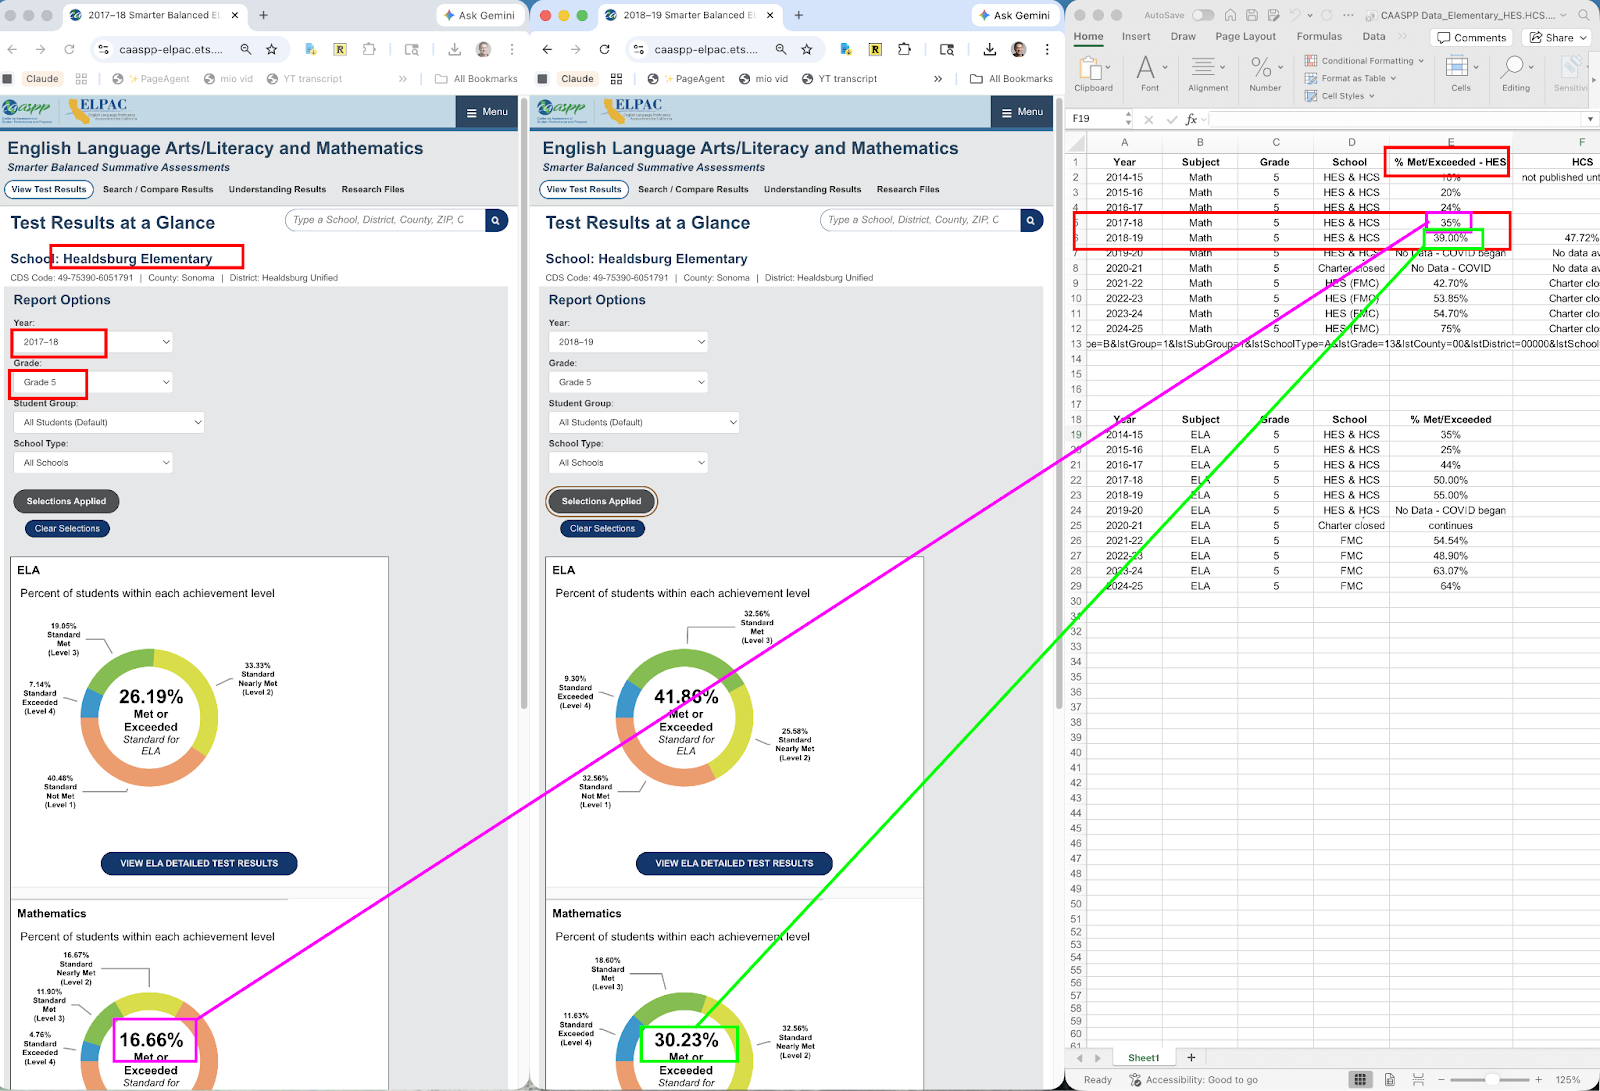
After I shared this screenshot with Dr. Fender, she acknowledged the numerical errors and said she would correct them. But I was disappointed when I reviewed YouCubed’s revised version of the article, posted on March 20, 2026, ‘updating’ some of the data. Although a key chart (the one that tells the story of dramatic math improvement) was replaced, no disclosure was made about what updates had been made.
More importantly, the new chart introduces a problem that is, in some ways, worse than the one it fixes. The original chart had wrong numbers. The new chart has hidden two significant confounds (the closure of a charter school and significant changes in the English Learner (EL) population) and results that did not replicate for 3rd or 4th grades.
Lastly, the case study’s entire reliance on a disconnected piece of quantitative data is ironic considering YouCubed is a recent signatory to a position paper proclaiming that quantitative education studies meeting strict scientific standards are of limited value. YouCubed’s own case study lacks any control group or disclosure of the significant limitations of its design. The double standard and material omissions suggest YouCubed’s and Dr. Boaler’s issue with quantitative evidence is not principled, but conditioned on whether it supports their preferred instructional methods.
What (Undisclosed) Changes Were Made
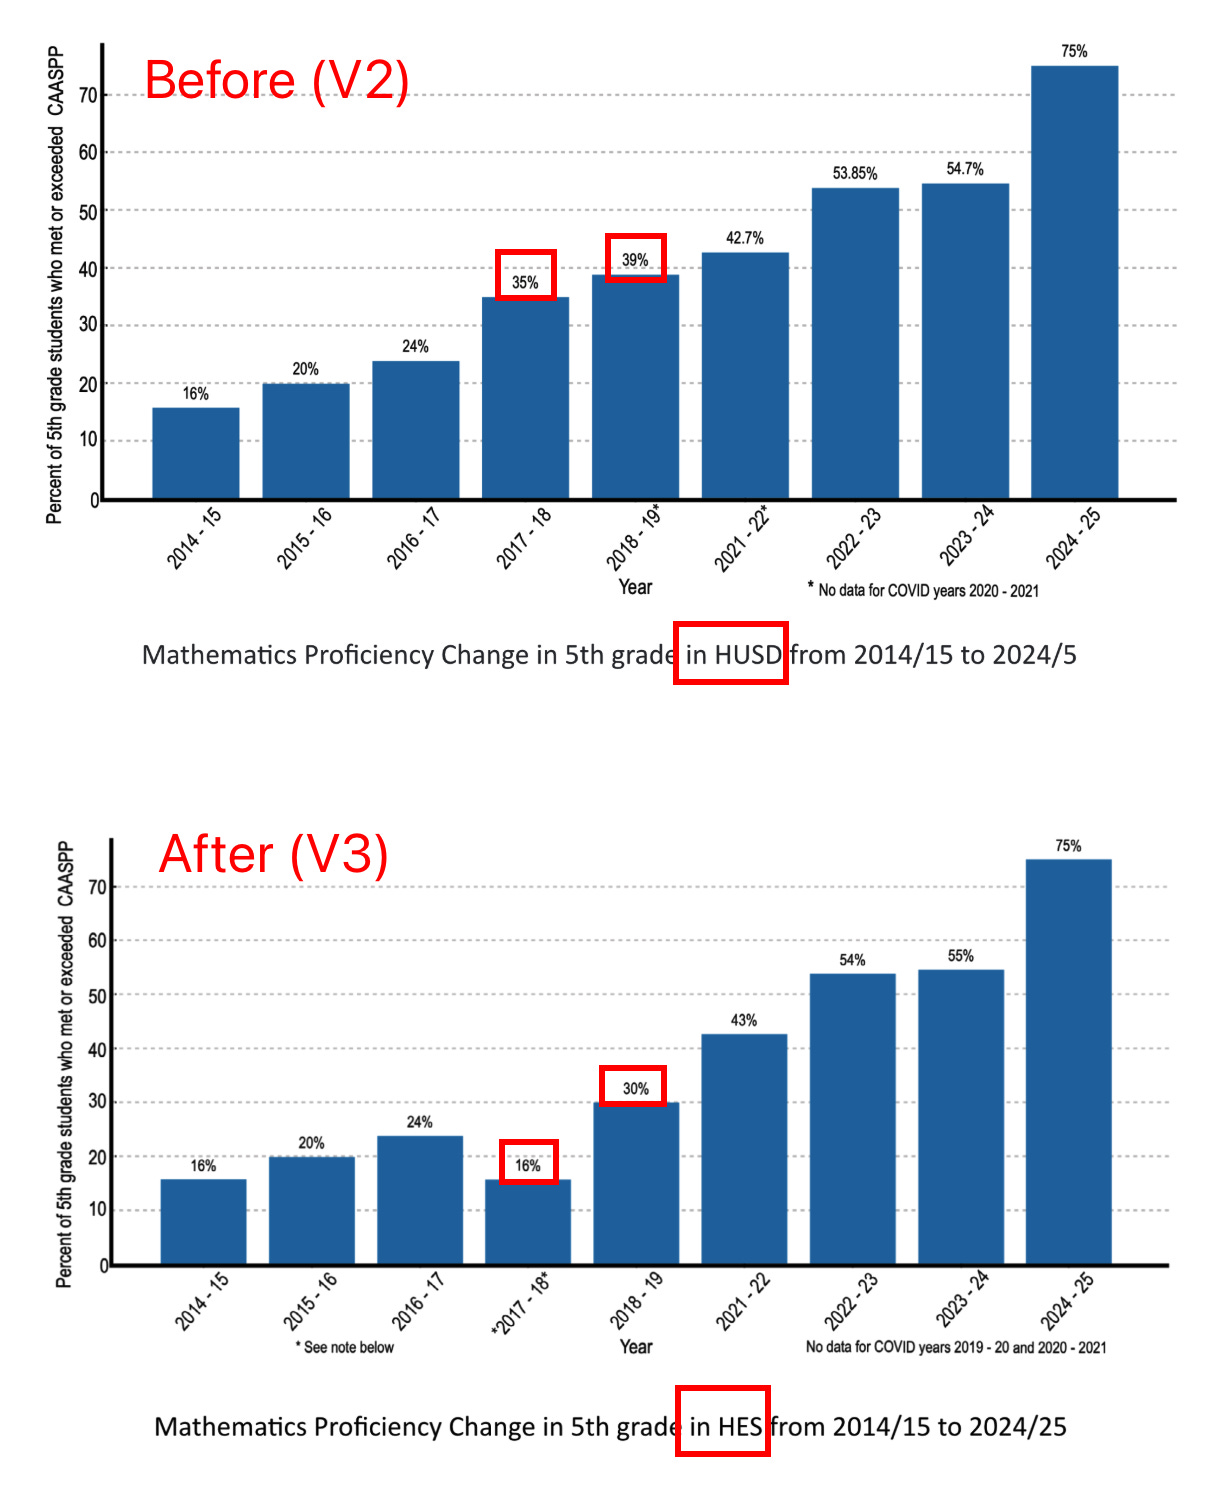
The original paper showed a chart labeled HUSD. My article pointed out that the numbers on that chart didn’t match the district’s official data.
In the revised version, the chart no longer shows district-wide data. It now shows data for a single school: Healdsburg Elementary School (HES). The revised version does not mention this significant change, one that significantly affects what the data mean.
The paper does not acknowledge that it originally showed district-wide data and now shows single-school data, a change that not only fundamentally alters what the chart shows, but also the conclusions that can be drawn from it.
The Fire That Only Affected 5th Graders
The revised paper, like the original, attributes a dip in scores to the Tubbs Fire, which devastated parts of Sonoma County in October 2017.
But 3rd and 4th grade math proficiency at Healdsburg Elementary went up in 2017–18. The dip is specific to the grade level shown on the paper’s chart.
If a community-wide disaster caused 5th grade scores to drop, you would expect to see a similar pattern in 3rd and 4th grade scores at the same school, in the same year. The paper offers no theory about why only 5th grade scores were affected.
Here are the CAASPP data for all three tested grade levels at Healdsburg Elementary:
Problematic Recent Score Trends for Grades 4 and 5
Grade 5 tells a beautiful story: a steady climb to 75% proficiency. But the YouCubed paper ignores grades 3 and 4. Both show gains through 2022–2023, and then both decline in the most recent years. Grade 3 math proficiency dropped from 65% to 56%. Grade 4 dropped from 55% to 46%.
The same school. The same teachers. The same “seven actions” that YouCubed’s paper claims is driving the student proficiency improvement. But only one of the three tested grade levels is going up, and it happens to be the one featured in the paper.
If the instructional approach is what’s driving the improvement, it should show up across grade levels. If improvement shows up only in one grade, a simpler explanation is that something specific to that grade is responsible.
But what other undisclosed and unrelated HES-specific changes may have caused dramatic increases in student performance?
The Charter School That Disappeared
Healdsburg used to have a second school serving elementary students: Healdsburg Charter School, a district-run charter school. Students were split roughly evenly between the two schools.
In 2019, a local paper, The Press Democrat, reported on how vastly different those two elementary schools were demographically from each other. Both HUSD administrators and local community members voiced concerns.
In 2020, HUSD closed the charter school, many of whose students then transferred to HES. The consequence of this closure is visible in the public data: HES 5th grade enrollment more than doubled (from 47 in 2018–2019 to 95 in 2020–2021). New students flooded in. Although total enrollment is down from its peak, demographics now are vastly different than they were before the charter school closed.
And here is the problem the revised paper does not address: when a school absorbs students from another school, the academic profile of its student body changes immediately and over the following years. If the incoming students have higher average achievement than existing students then, as those higher performing students age, each grade’s overall proficiency rate would rise, not because instruction improved, but because the composition of the student body changed.
In the 2018–2019 school year, the two schools had dramatically different math proficiency rates:
From the chart above, it’s easy to see that moving Healdsburg Charter’s students into HES would improve HES’s math performance.
The English Learner Confound
Another major confound is the significant success HES has had getting English Learners (ELs) to fluency, and the decline in general in ELs. The subsequent positive academic results for ELs are likely due not just to the closing of the charter school, but also to changes in the HES EL program.
Talking with The Press Democrat in 2019, HUSD Superintendent Chris Vanden Heuvel blamed the academic performance gaps between the then-two schools on a problematic EL program at HES that the district ended in 2017 or 2018 (i.e., prior to the charter school closing). He also made other recommendations to improve EL performance, to be implemented beginning in the 2020–21 school year.
The evidence backs up the positive effects of Vanden Heuvel’s efforts on ELs. Beginning in 2017 or 2018, the data show that HES became increasingly successful at getting its ELs to acquire English language fluency at earlier grade levels. This is reflected in the chart below, and it is noteworthy that these improvements occur at almost the same time period covered by YouCubed’s chart. As a result, HES’s English Language Arts standardized test scores improved significantly between 2014–2015 and 2024–2025. (For 3rd and 4th grades, this improvement was greater than the improvement in math scores.)
The chart below shows the percentage per grade level of HES students who were Reclassified Fluent English Proficient (RFEP, i.e. former ELs who are no longer identified as ELs):
The percentage of ELs in the HES student body also declined dramatically between 2015 and 2025 as shown below. This decline cannot be fully attributed to improvements in its EL program and is not disclosed in the YouCubed paper. Conversely, the YouCubed paper states “60% of entering kindergartners are English Language Learners” without mentioning the dramatic decline in ELs in the tested grade levels as shown below.
These are textbook confounds. As Stanford University Education Professor Linda Darling-Hammond has noted, cohorts with fewer ELs score higher on standardized tests simply because acquiring a new language takes 5–7 years.
The revised YouCubed paper does not mention any of these significant variables. It does not contain the word ‘charter’ at all and only mentions “English Language Learners” once. Instead, it simply presents the rising HES proficiency numbers as evidence that YouCubed’s preferred instructional methods drove improvement.
Doubting Quantitative Data, and Using It Selectively
This selective use of evidence is a well-known, long-standing issue with Dr. Boaler (here, here, here) and similar issues have been noted with YouCubed (here, here). Moreover, YouCubed recently endorsed a position paper that downplays quantitative evidence in education research — a stance Dr. Boaler has held for decades. Yet this case study relies on a long-term standardized test trend in one grade level as proof of success.
When using such data, the case study should have been controlling for factors like income, race/ethnicity, EL status, special education status, and prior achievement, because changes in the student population can artificially inflate or deflate results. Or, at the very least, the case study should have disclosed the potential issues with not controlling for such other factors.
Without a well-defined control group, any observed gains in that one grade level could just as easily be due to normal maturation, teacher effects, changes in curriculum, or shifting student demographics rather than the mindset program itself. Moreover, the strongest designs don’t just compare students to “business as usual,” but also benchmark against a group receiving evidence-based instruction recommended by the U.S. Department of Education and shown to improve student academic achievement (e.g., structured, explicit teaching with guided practice and feedback, memorizing math facts) to see whether the mindset intervention adds anything beyond what is already known to improve learning.
In fact, the YouCubed case study lists a number of other changes to the HES math program that had nothing to do with a “mathematical mindset” approach, such as:
aligning teaching to standards
using multiple curricular resources to supplement core curriculum
using more formative assessments
testing instructional changes and reviewing student evidence together
creating teacher learning teams for collaboration
giving teachers structured collaboration time
engaging parents and families
creating a STEM specialist model
ensuring math was taught by teachers who liked and focused on math
using a two-teacher model for math for grades 3-5
Improvements in the one grade level in the case study could just as easily reflect a different student population, other instructional changes, or external factors, rather than the approach YouCubed is promoting.
What This Adds Up To
When I first saw issues with the data in the study, I thought of the type of questions Dr. Boaler recommends students ask themselves when looking at data:
In these middle grades, students can start to become vital consumers of data, asking questions such as, “Is this a fair and clear way to represent the data?” Students can also learn to deal with uncertainty in data collection, analysis, and representation and reflect on how their decisions in each of these steps have the potential to introduce bias.
Each of these issues identified above might have an innocent explanation. But, taken together, these problems paint a picture of a paper that is not rigorous enough to support the claims it makes, and of a correction process that introduced a larger problem than the one it sought to fix.
If the evidence for this approach is as strong as the authors claim, why does it keep falling apart when someone checks?
Attacks on Excellence


 | A guest post by
|