
The 2026 March Education Madness Tournament
Eight states stood out from the crowd of 50 for their student performance. Which one will win March Education Madness?


Check out the polls at the end of this post to share your predictions for the Elite Eight rounds!
Which states have education policies that best foster student excellence?
It’s a question that gets asked surprisingly rarely — and when it does, the answers tend to rely more on reputation than evidence. Though the tide is slowly turning, many still assume Massachusetts is good and Mississippi is bad, and leave it at that.
We wanted to do better. Starting today and culminating with a Championship on April 6th, Education Progress is running our first March Education Madness Tournament — a state-by-state, data-driven competition to find out which state best promotes educational excellence across the socioeconomic spectrum.
The Field
Fifty states is a lot of states. We needed a way to organize the field that was simple, defensible, and didn’t require us to make judgment calls about which states belong together.
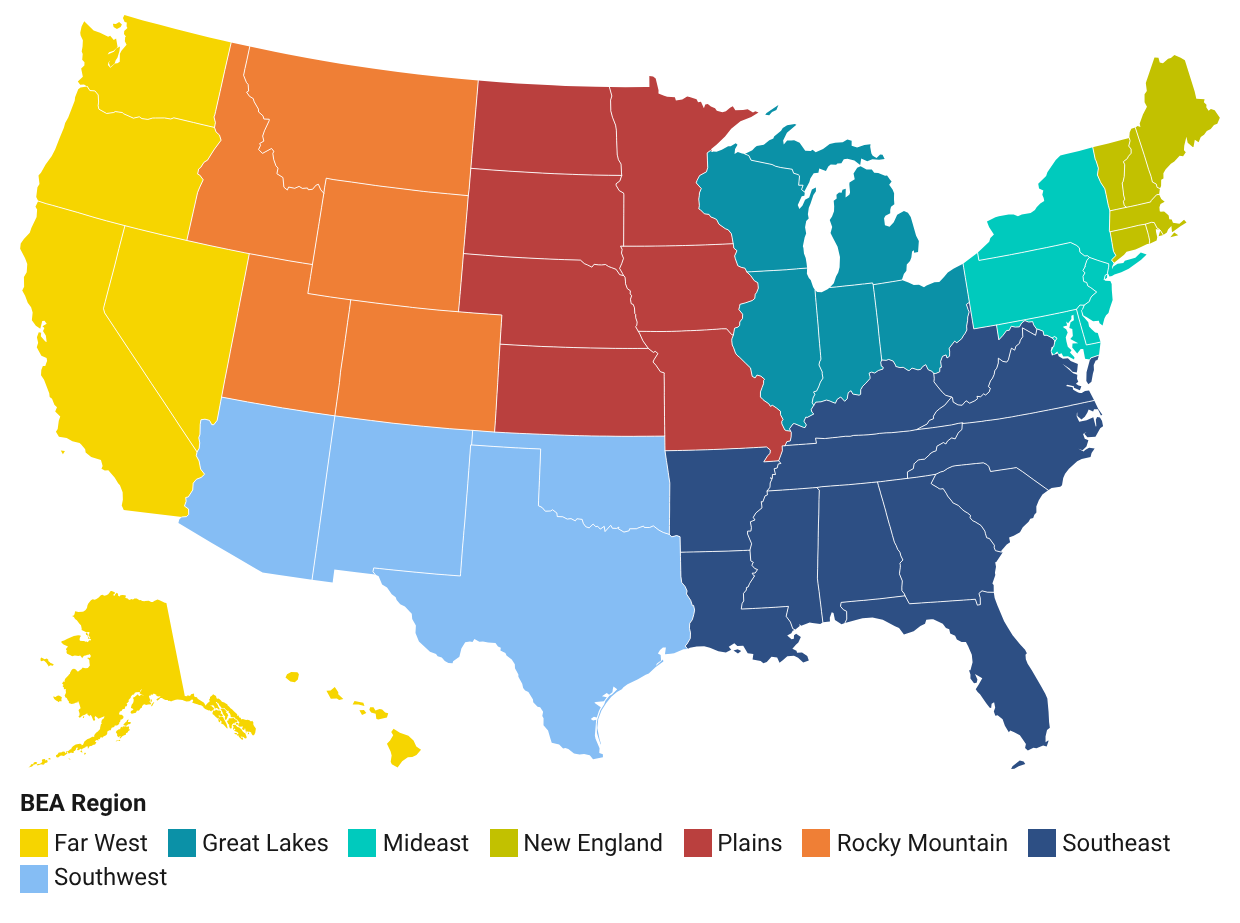
The U.S. Bureau of Economic Analysis already does this by dividing the country into eight regions based on economic and social similarities. States in the same BEA region tend to share demographic profiles, policy traditions, and labor markets. So we borrowed their map and turned each region into a conference.
Each round of the tournament will run a bit differently — mostly because reiterating and re-reading the same analyses round after round would be extremely tedious, but also because it provides an opportunity to illustrate different ways states can either support or impede educational excellence.
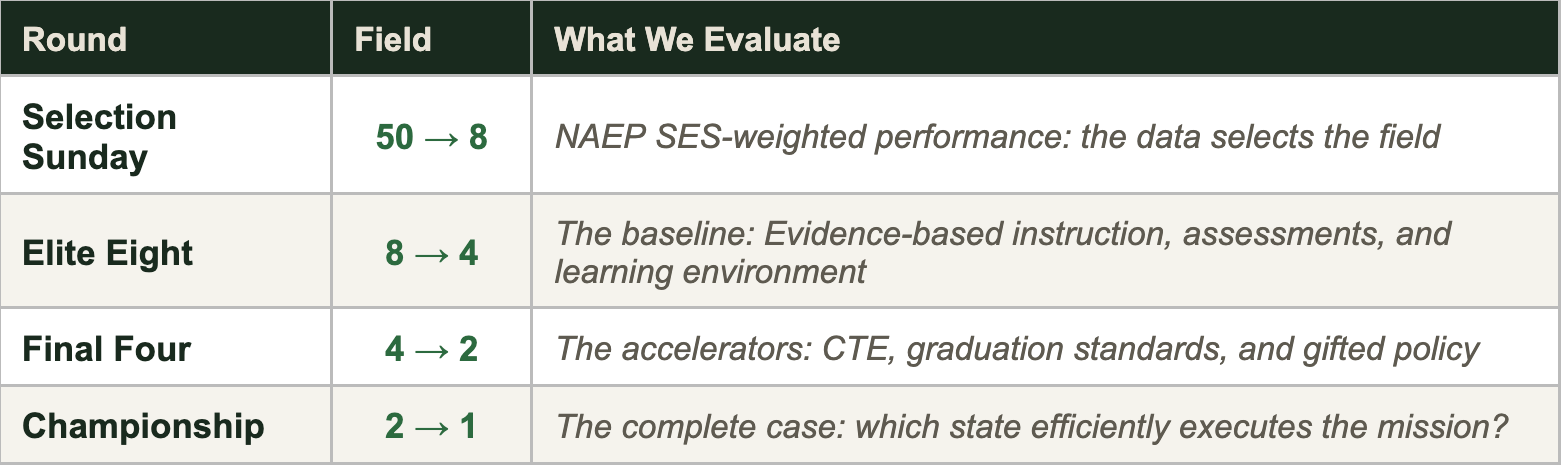
For this first round — the Regional Qualifiers — one state will be selected as a standout in educational excellence from each region, and they will advance to our Elite Eight bracket. We go into more detail about the regional matchups below, but generally speaking we wanted the scoring framework and the results to be relatively straightforward and simple for winnowing fifty states down to eight. So we gave every state a weighted score based on how well their lower, middle, and higher-income students perform on the NAEP’s national 4th- and 8th-grade math and reading tests, with greater weights given to how well the state supports its middle-class and disadvantaged students.
From here, the regional winners will face off in a single-elimination format in four Elite Eight rounds — the Far West, Rocky Mountains, Southwest, and Plains on one side of the bracket, and the Great Lakes, Southeast, Mideast, and New England on the other. The NAEP data got them through the regionals, but here we will more closely examine why, considering each state’s (1) evidence-based instruction, (2) assessments and accountability, and (3) discipline and school climate. Each Elite Eight round will evaluate the competing states against these different policy questions.
The Final Four will consist of the states that have these fundamentals locked in, and so we will have to dig a bit deeper for these faceoffs. In these two matchups, the contenders will be evaluated according to (1) the alternative education pathways they provide, (2) their graduation standards and graduate profiles, and (3) their overall gifted and talented education policy.
We will share more details about the Championship Round in a couple weeks. Throughout the tournament, though, the pro-excellence checklist will deepen as the field narrows. What matters first are the fundamentals, then the policies that supercharge excellence, and then their execution on those policies. In each successive post, the previous winners’ policies will be scrutinized in head-to-head contests until we finally crown our National Champion of Educational Excellence.
But first, and finally — which states will be advancing from the Regional Qualifiers to the Elite Eight? (Stay tuned to find out after a message from our sponsor, DraftKings. Just kidding.)
The Regional Qualifiers: Which States Lift All Boats?
To select our Elite Eight, we’re using a widely referenced measure of student achievement in the country: the National Assessment of Educational Progress (NAEP), also known as the Nation’s Report Card.
For the first time in 2024, NAEP introduced a Socioeconomic Status (SES) Index that goes beyond free-lunch eligibility, to capture a richer picture of students’ economic, social, and cultural resources. The index classifies students into three categories — Low SES, Middle SES, and High SES — and reports average scores for each group at the state level in both mathematics and reading, at grades 4 and 8.
We use these scores to answer a simple question: Which state in each region gets the best results across the socioeconomic spectrum, and who does so for the students most in need of academic resources?
How It Works
Step 1 — Rank. For each of the four NAEP assessments (Grade 4 Math, Grade 4 Reading, Grade 8 Math, Grade 8 Reading), we rank all states by their average score within each SES category (Low, Middle, High). Highest weighted average NAEP scores = Rank 1. This produces 12 rankings per state (4 assessments × 3 SES levels).
Step 2 — Weight. Not all performance is equal. A state that serves its Low SES students well is doing something harder and more important than a state that merely rides the advantages of wealth. We apply the following weights to each SES rank:
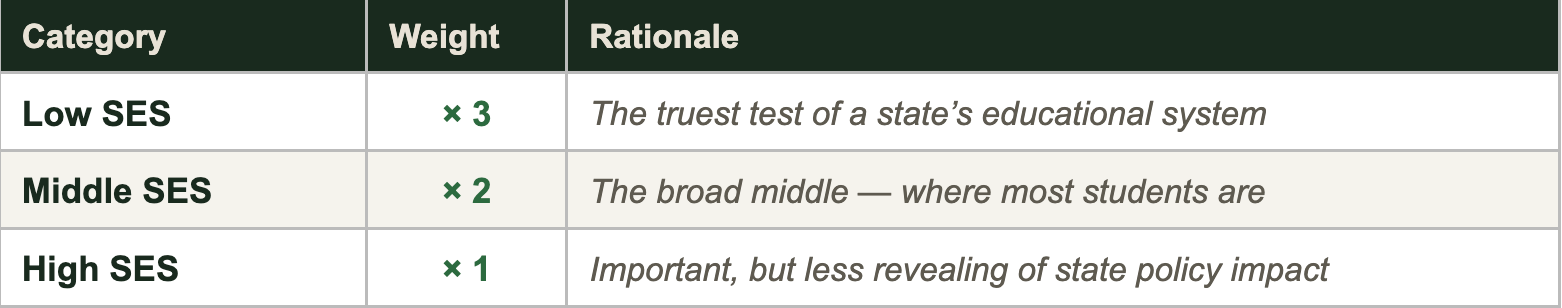
Step 3 — Score. For each state, we compute a Seed Score for each of the four assessments:
Grade 4 Math Seed Score = (Low SES rank × 3) + (Middle SES rank × 2) + (High SES rank × 1)
Grade 4 Reading Seed Score = (Low SES rank × 3) + (Middle SES rank × 2) + (High SES rank × 1)
Grade 8 Math Seed Score = (Low SES rank × 3) + (Middle SES rank × 2) + (High SES rank × 1)
Grade 8 Reading Seed Score = (Low SES rank × 3) + (Middle SES rank × 2) + (High SES rank × 1)
These four Seed Scores are then summed into a single Total Seed Score. The state with the lowest Total Seed Score has the strongest overall performance across the two grade levels and both subjects, with greater weight given to how well the policy serves its middle-income (2x) and disadvantaged (3x) students.
Step 4 — Select. Within each of the eight BEA regions, the state with the lowest Total Seed Score advances to the Elite Eight.
Interpreting the Results
This rank-based score is designed for clarity, not fine-grained precision. When two states finish with very close scores, we flag it — as a “photo finish” (within 5%) or a “virtual tie” (within 2%) — and show the NAEP point differences so readers can see whether the matchup was decisive, or effectively a coin flip. Round 1 is thus a quick, transparent way to pick regional standouts. We are not claiming that #1 is meaningfully better than #2. For this tournament, we just wanted a fast way to see which states were moving in the right direction.
A Note on Missing Data
The 2024 NAEP SES Index is not available for every state. Alabama, Alaska, Colorado, New Hampshire, South Dakota, and Utah had insufficient data for the SES index in 2024 and are noted with an asterisk (*) in the regional tables. For the Rocky Mountain region — where both Colorado and Utah are missing from the SES index — we use overall NAEP average scores (all students) instead of SES-weighted ranks to ensure the region’s full five-state field competes. All other regions use the SES-weighted method, with missing states excluded from their regional field.
Regional Results & the Elite Eight
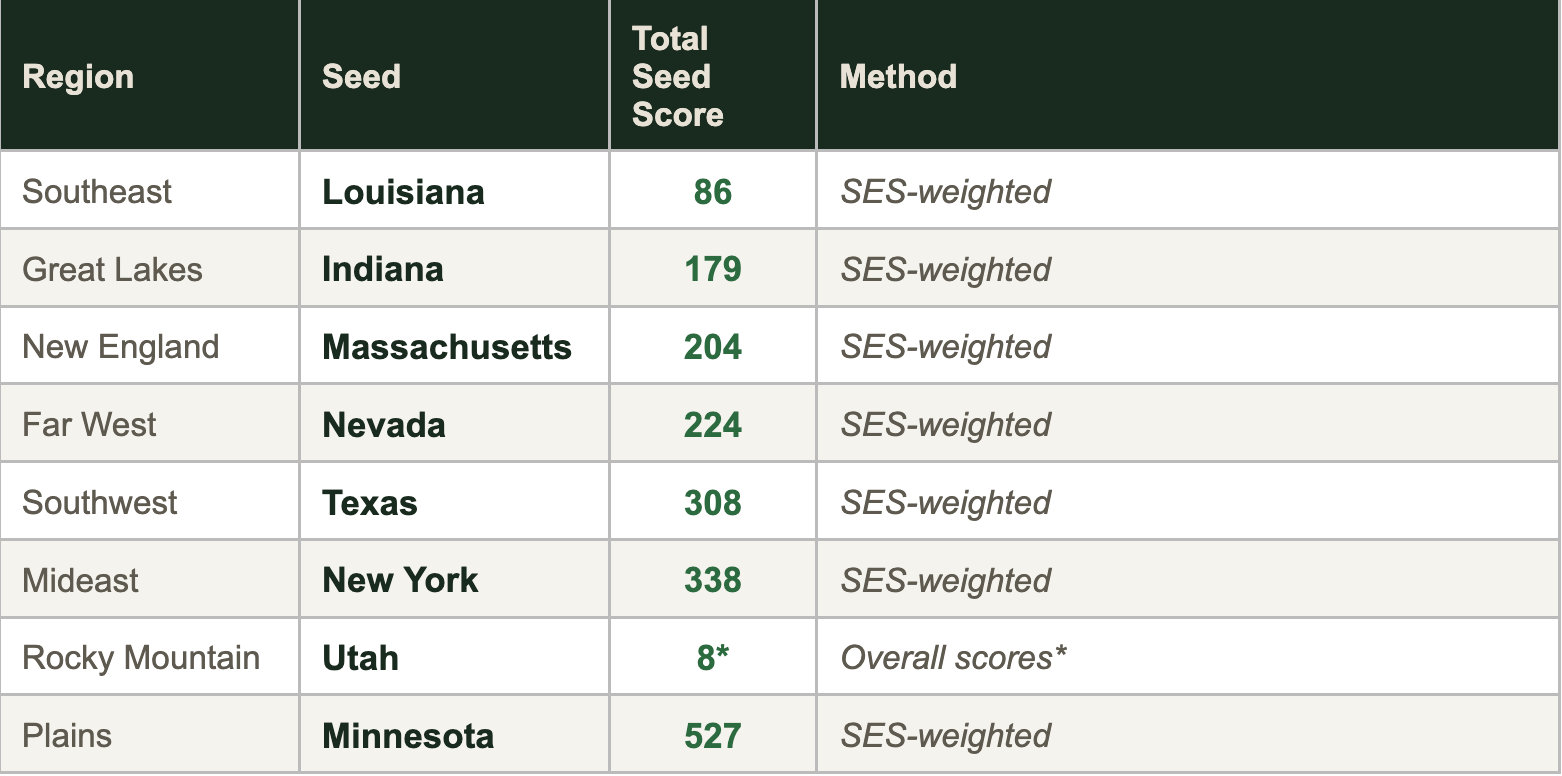
Massachusetts emerges from the New England regional qualifiers. Winner by Seed Score: Massachusetts (204) over Connecticut (594).
Massachusetts led in all 12 subgroup cells, averaging +5.9 NAEP points across the board. Its High-SES students ranked 2nd nationally in 4th-grade math and 1st in 8th-grade math, but the win wasn’t just about wealthy kids — its Low-SES ranks ranged from 8th to 13th across all four assessments. Connecticut had strong High-SES performance (7th in 4th-grade reading, 5th in 8th-grade reading) but its Low-SES students ranked in the 30s and 40s in three of four assessments, and that gap cost it under our weighting.
New York wins the Mideast qualifiers. Winner by Seed Score: New York (338) over New Jersey (383).
New York led in 7 of 12 cells, though New Jersey actually averaged slightly higher in raw NAEP points (+1.1). New Jersey had the stronger High-SES showing — including 4th nationally in both 8th-grade math and 8th-grade reading. But New York’s Low-SES students ranked 5th in 8th-grade math and 12th in both 4th-grade reading and 8th-grade reading. With Low-SES weighted at 3x, that was enough.
Indiana advances from the Great Lakes qualifiers. Winner by Seed Score: Indiana (179) over Ohio (318).
Indiana led in 11 of 12 cells, averaging +2.2 NAEP points. Its Low-SES students ranked 3rd nationally in 4th-grade reading and 4th in 8th-grade math — numbers that would be competitive in any region. Ohio’s one win came in High-SES 8th-grade math, where it ranked 11th nationally to Indiana’s 19th, but that wasn’t nearly enough to close the gap.
Minnesota moves on from the Plains qualifiers. 📸 Winner by Seed Score: Minnesota (527) over Nebraska (554).
Photo finish. Minnesota and Nebraska both scored 135 in 4th-grade math and were within 4 points in 4th-grade reading. Nebraska had the better 8th-grade math result — its Mid-SES students ranked 4th nationally there, compared to Minnesota’s 12th. Minnesota pulled ahead in 8th-grade reading (weighted score of 137 vs. 179). With the totals this close (527 vs. 554), the tiebreaker went to combined Low-SES rank, where Minnesota’s 84 edged Nebraska’s 94.
Louisiana leads the Southeast qualifiers. Winner by Seed Score: Louisiana (86) over Mississippi (94).
Louisiana posted the lowest total seed score (86) in the entire 44-state SES-weighted field, earning that through remarkable 8th-grade results. Its Mid-SES students ranked 1st nationally in both 8th-grade math and 8th-grade reading, and its Low-SES students ranked 7th and 1st in those same assessments. Its 8th-grade reading weighted score of 6 — reflecting ranks of 1st, 1st, and 1st across all three SES categories — was the single strongest assessment result in the tournament. Mississippi was actually stronger in 4th grade, with Low-SES students ranking 2nd in math and 1st in reading, but Louisiana’s 8th-grade dominance sealed it.
Texas takes the Southwest qualifiers. Winner by Seed Score: Texas (308) over Oklahoma (548).
Texas led in all 12 subgroup cells, averaging +4.6 NAEP points over Oklahoma. Its Low-SES students ranked 3rd nationally in 4th-grade math — the best mark among all eight Elite Eight qualifiers. Its profile showed strength across the board in the earlier grades, though there’s more ground to make up by 8th-grade reading, where its Low-SES students ranked 29th. Oklahoma had decent Low-SES 4th-grade math performance (9th nationally) but fell off in the upper grades.
Utah rocks the Rocky Mountains qualifiers. (Overall scores method.) Winner by Rank Sum: Utah (8) over Colorado (10) and Wyoming (10).
With SES data unavailable for Utah and Colorado, this region used overall NAEP averages. Utah led the region in 8th-grade math (281.8) and placed 2nd in 4th-grade math (241.5) and 8th-grade reading (261.2). Colorado edged Utah in 4th-grade reading (220.9 vs. 219.3) and 8th-grade reading (264.5 vs. 261.2), but Utah’s math advantage was decisive. Wyoming led in both 4th-grade assessments but dropped to 5th in 8th-grade reading, costing it the tiebreaker with Colorado.
Nevada nabs the Far West qualifiers. Winner by Seed Score: Nevada (224) over California (473).
Nevada led in 8 of 12 cells, averaging +1.5 NAEP points over California. The story here is Low-SES performance: Nevada’s disadvantaged students ranked 4th nationally in 4th-grade math, 2nd in 4th-grade reading, 3rd in 8th-grade math, and 2nd in 8th-grade reading. California had the stronger High-SES results (5th in 4th-grade math, 3rd in 8th-grade math) but its Low-SES students ranked in the upper 20s and 30s. With our 3× Low-SES weighting, Nevada’s advantage was comfortable.
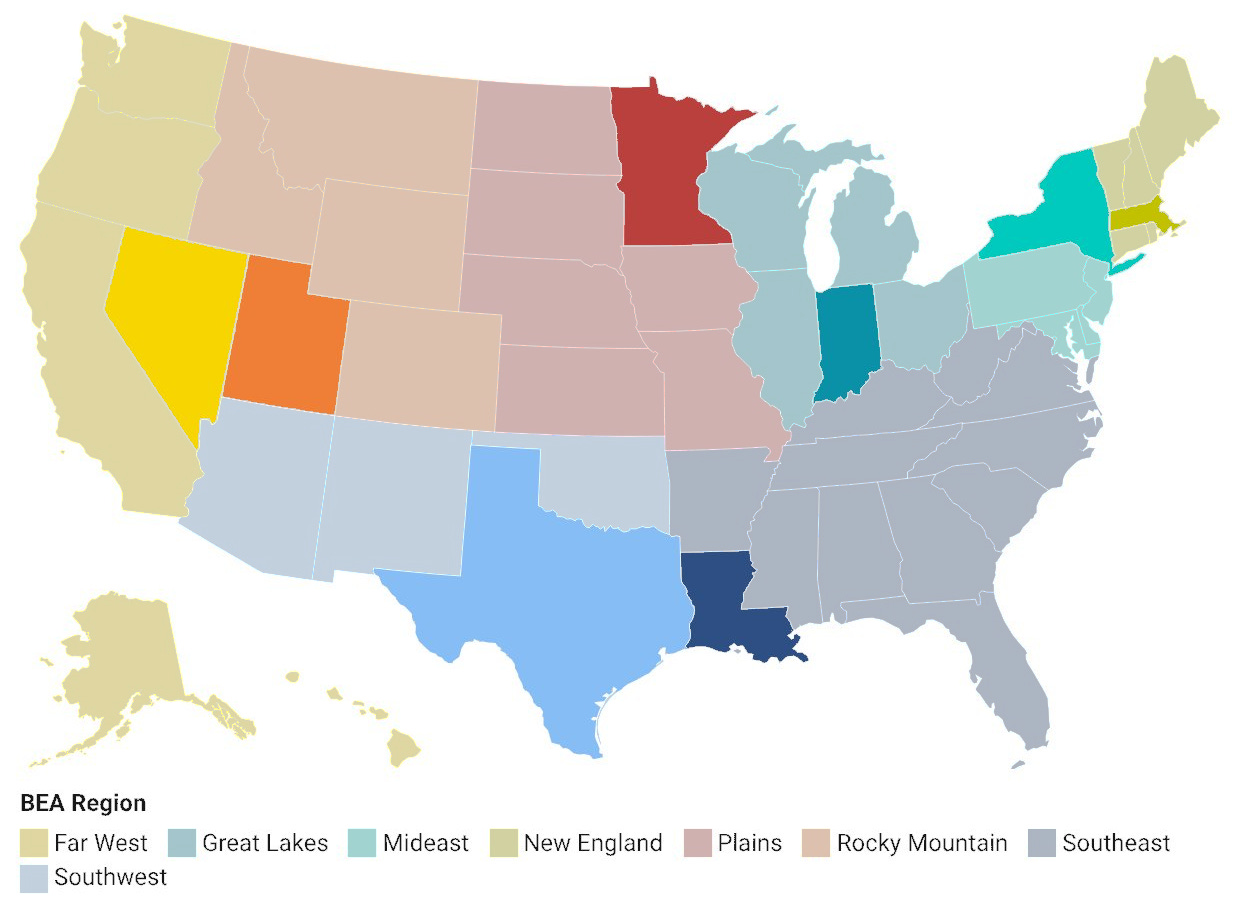
Our 2026 Elite Eight
How the Lens Sharpens Each Round
Bracket Schedule
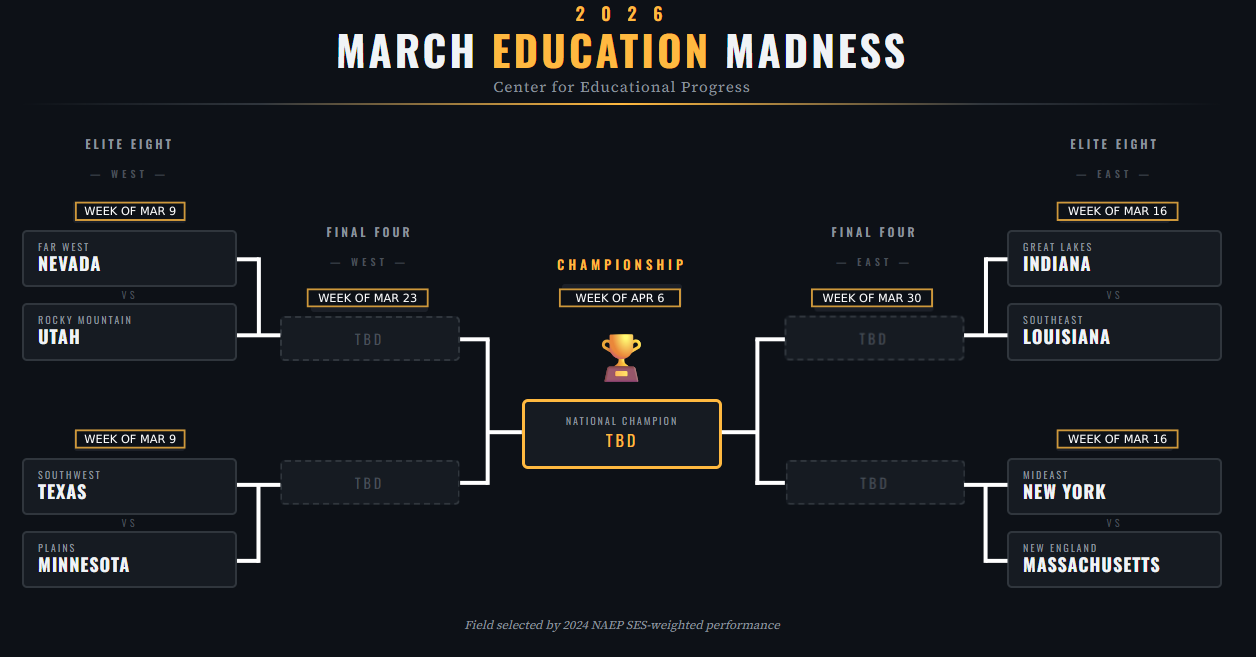
Now the real competition begins. Our Elite Eight face off in a single-elimination bracket, with the West and East sides advancing in parallel. In the Elite Eight, we evaluate whether each state has the fundamentals in place: evidence-based instruction, meaningful assessments, and a learning environment that protects the classroom.
West Elite Eight: Nevada vs. Utah — March 10th | Texas vs. Minnesota — March 12th
East Elite Eight: Indiana vs. Louisiana — March 16th | New York vs. Massachusetts — March 19th
In the Final Four, we move to the policies that supercharge excellence: career and technical education pathways, rigorous graduation standards, and gifted and talented programming.
West Final Four: week of March 23rd
East Final Four: week of March 30th
And in the Championship, we’ll be asking which state backs its policies with real investment, and does so efficiently.
Championship: week of April 6th
The last state standing gets crowned the 2026 Champion of March Education Madness.
 | A guest post by
|